- How can we help our students to connect the topics we teach?
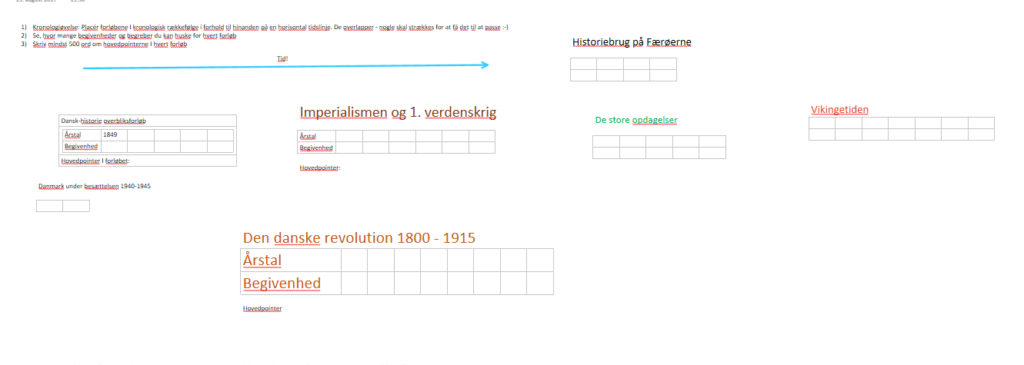
1: Timelines as different tables on the canvas
This exercise utilizes 3 cool features of OneNote:
- The infinite scroll. There is no limit to the scope of a timeline, and you can go back and expand and elaborate on it.
- The free movement of content boxes around the canvas. Students can shuffle and play around with content boxes prepared by the teacher
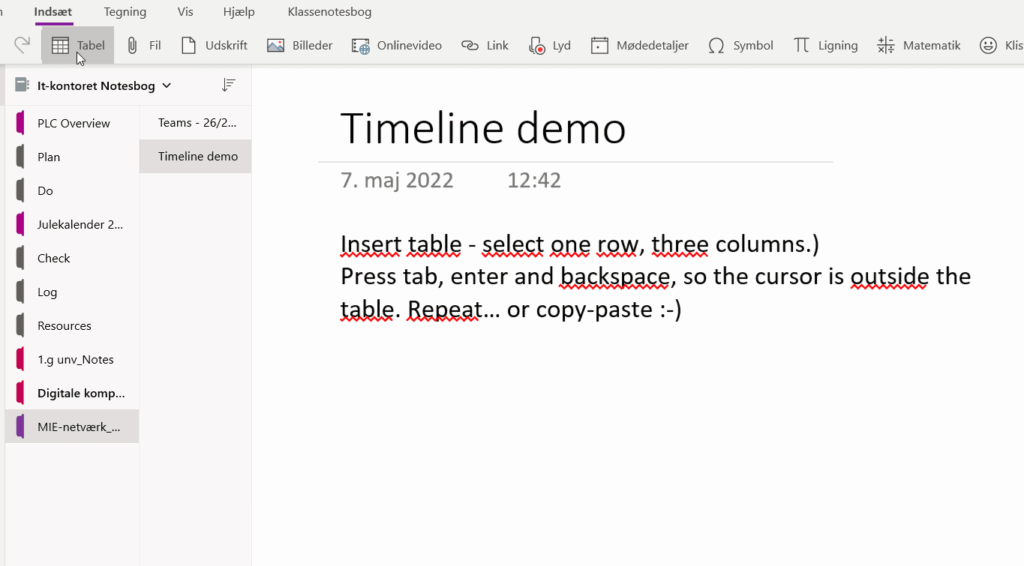
- The ease of creating tables by hitting the ‘tab’ key: If you want to create a vertical timeline, you can just press ‘tab’ and OneNote creates an empty cell for a year. When you have enough years, just click ‘ctrl’ + ‘enter’ and you can start adding information to your timeline.
I simply created a page with 6 content boxes containing a timeline each of a history course, and then distributed the page to the individual student sections.
Their job was to place the content boxes in chronological order, and then finish the timelines of the different courses by adding as many important events and years as they wanted.

Images and videos could also be added ‑but that might disturb the purpose of the exercise, which is to develop/support/maintain the chronological overview.
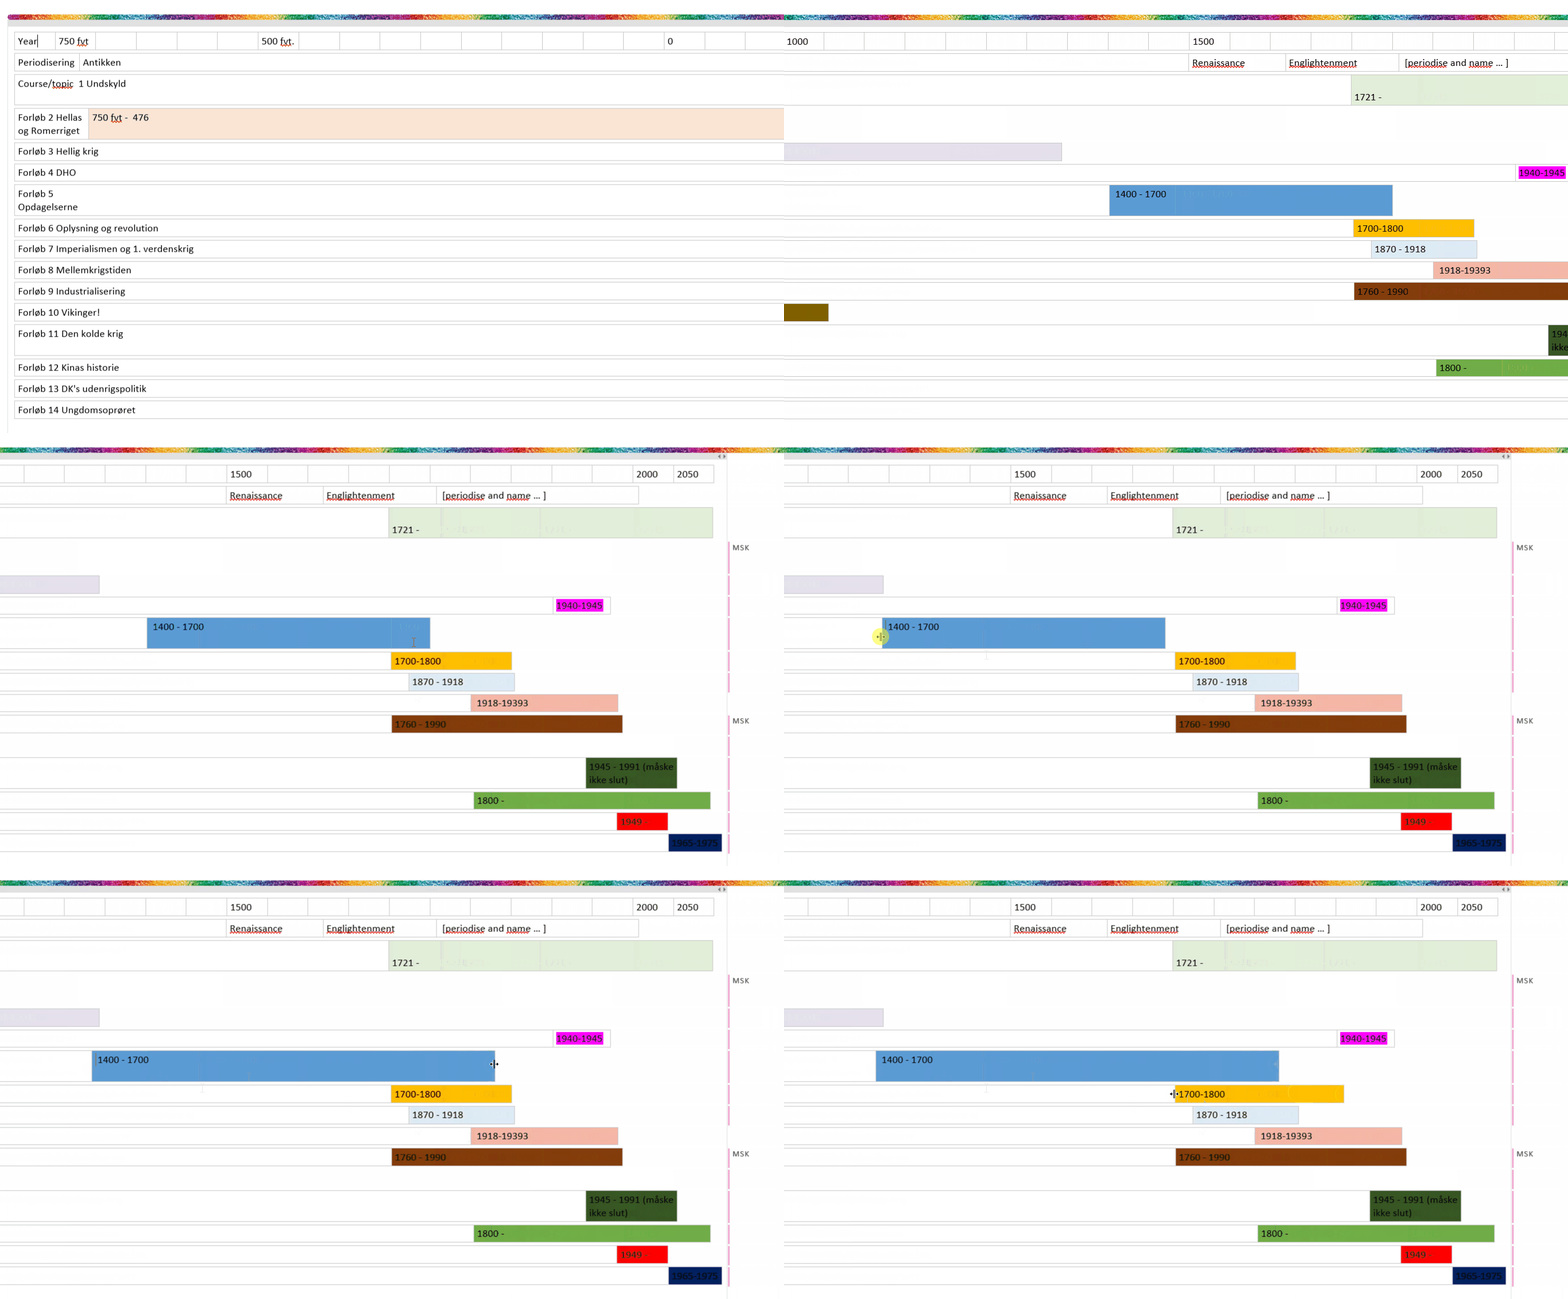
2: All topics in one table
This year I tried another approach for repetition of 14 different topics taught over 3 years in nonchronological order. I created a template with all topics and then the students had to divide european history into periods and place the topics in the template.
If we zoom out, we see which parts/ages of history, we are shedding a light on, and which parts are left in the dark.
When the students are finished building this overview, they should answer the following questions:
Why do you think you have been taught topics in just Danish history?
When was Danish history particularly influenced by World history?
Which principles have you used for periodization?
What does this visualization tell us?


Have you tried using OneNote for timelines?


Skriv et svar